Yosef Birhanu

DATA ANALYST | POWER BI SPECIALIST

Turning Data Into Business Decisions.

I transform complex business data into clear dashboards, actionable insights, and smarter decisions.

About

Analytical thinking, clearly presented.

I'm a developing Data Analyst and Power BI specialist focused on turning raw business data into useful insights. My work combines data preparation, analytical thinking, dashboard development, and business-focused reporting.

I enjoy investigating business performance, identifying patterns, and presenting information in ways that help decision-makers understand what is happening and what they should investigate next.

My current focus is building practical projects in sales analysis, customer analytics, inventory operations, and profitability analysis.

Current tools

  • Power BI
  • Excel
  • SQL
  • Power Query
  • DAX
  • Statistics

The projects below are personal portfolio projects, not paid client work.

View Featured Projects

Skills

What I work with

Business Intelligence

  • Power BI
  • Dashboard Development
  • KPI Reporting
  • Business Performance Analysis

Data Preparation

  • Power Query
  • Data Cleaning
  • Data Transformation
  • Data Validation

Data Analysis

  • Excel
  • SQL
  • Sales Analysis
  • Customer Analysis
  • Inventory Analysis
  • Profitability Analysis
  • Statistics

Analytical Communication

  • Business Insights
  • Data Visualization
  • Findings and Recommendations
  • Analytical Storytelling

Portfolio

Featured Projects

Personal portfolio projects built in Power BI. Select a project to see its screenshots and case study.

Executive overview page of the E-commerce Inventory and Operations Power BI dashboard

Inventory Analytics / Business Intelligence

E-commerce Inventory & Operations

An interactive Power BI project focused on inventory performance, supplier analysis, operational reporting, and business recommendations.

Executive overview page of the E-commerce Sales and Customer Analysis Power BI dashboard

Sales Analytics / Customer Analytics

E-commerce Sales & Customer Analysis

An interactive Power BI project examining sales performance, product and category trends, customer behavior, and regional sales patterns.

GreenMart sales and profitability Power BI dashboard

Retail Analytics / Profitability Analysis

GreenMart Sales & Profitability Analysis

A Power BI dashboard project focused on presenting sales and profitability information for business performance monitoring.

Services

How I can help

Types of analytical work I can offer. Scope and timelines are agreed per project.

Power BI Dashboard Development

What it does: Turns prepared data into interactive dashboards.

Problem addressed: Teams cannot see performance in one clear place.

You receive: A working Power BI dashboard built around your key questions.

Excel Reporting and Analysis

What it does: Structures and analyzes data in organized workbooks.

Problem addressed: Manual, inconsistent spreadsheet reporting.

You receive: A clean Excel report with clear summaries.

SQL Data Analysis

What it does: Queries databases to answer specific business questions.

Problem addressed: Useful answers stuck inside raw tables.

You receive: Documented queries and a summary of results.

Data Cleaning and Transformation

What it does: Fixes errors, standardizes formats, and reshapes data.

Problem addressed: Unreliable data that weakens every report.

You receive: An analysis-ready dataset and notes on what changed.

Sales Performance Analysis

What it does: Examines sales by period, product, and region.

Problem addressed: Unclear drivers behind sales movement.

You receive: Findings with practical points to investigate.

Inventory Analysis

What it does: Reviews stock levels, replenishment, and supplier data.

Problem addressed: Limited visibility into stock and fulfillment issues.

You receive: An inventory report or dashboard with recommendations.

Customer and Product Analysis

What it does: Studies customer behavior and product performance.

Problem addressed: Not knowing which customers and products matter most.

You receive: Clear segment and product views with insights.

Business KPI Reporting

What it does: Defines and tracks the metrics that matter to you.

Problem addressed: Metrics that are scattered or defined inconsistently.

You receive: A consistent KPI report or dashboard.

Work Process

How I approach a project

  1. Understand the business question.

  2. Inspect and validate the data.

  3. Clean and transform the data.

  4. Analyze the data and calculate relevant KPIs.

  5. Build the dashboard or report.

  6. Explain findings and recommend practical next steps.

Learning

Learning

Current learning focus

  • Power BI data modeling and DAX
  • SQL for business analysis
  • Statistics for analysts
  • Analytical storytelling

Contact

Let's talk about your data.

Have a reporting, dashboard, or analysis project in mind? Send me a message and we can discuss how I can help.

Email: yosefbirhanu02@gmail.com

Inventory Analytics / Business Intelligence

E-commerce Inventory & Operations

An interactive Power BI project focused on inventory performance, supplier analysis, operational reporting, and business recommendations. This is a personal portfolio project.

Dashboard screenshots

Case Study

1. Project overview

An e-commerce business ships from four warehouses (Adama, Addis Ababa, Bahir Dar, and Hawassa) and buys from twelve suppliers. After cleaning the data in Power Query and building a Power BI model with DAX, a four-page dashboard answers five operational questions.

2. Business problem

Leadership wants to cut stockouts and excess inventory without hurting profit or fulfillment. These goals pull against each other: more stock protects sales but ties up cash, and less stock frees cash but risks lost orders.

The work is operational diagnostics (what is wrong and where), not forecasting.

3. Project objectives

Answer five operational questions: which products need replenishment, which are overstocked, how much stock value is tied up, which warehouses show high cancellation and return rates, and which suppliers pose risk.

Deliverables: cleaned data and a Power BI model (Power Query and DAX), a four-page dashboard, five evidence-based insights, and three recommendations.

4. Dataset overview

The workbook contains four tables:

OrderLines_Raw: 901 rows (898 after cleaning), one row per order line (sales facts).

Inventory_Snapshot: 60 rows, one row per product on 2025-12-31 (stock facts).

Products: 60 rows, one row per product (the hub dimension).

Suppliers: 12 rows, one row per supplier (dimension).

5. Data quality issues

Duplicate and invalid rows: one exact duplicate order line (LINE00016) and one line with an invalid ProductID (P999).

Wrong or missing values: a negative UnitPrice (-12.50 on product P006), a missing Quantity (LINE00061), a missing DiscountRate (LINE00046), and an invalid ReturnedFlag value of 2.

Inconsistent text in the Warehouse and FulfillmentStatus fields.

Conflicting definitions: three different lead-time fields, and a ReorderPoint below SafetyStock for 12 products.

6. Data cleaning and transformation

Every change was made in Power Query, with the raw table left untouched. Corrected values are flagged in the data, so a reviewer can filter them out.

Removed: the duplicate line (it would double count sales), the line with invalid ProductID P999 (no category, supplier, or stock record to link to), and the line with missing Quantity (it cannot be inferred, and imputing would invent values).

Corrected and flagged: the negative price was replaced with the master price of 81.50 (all other lines matched their master price); the missing discount was set to 0%, the most common rate; the invalid ReturnedFlag was recoded to 0, because the status was Completed and all returned lines carry flag 1.

Standardized: text in Warehouse and FulfillmentStatus was trimmed and capitalization fixed, merging duplicate categories.

Resolved definitions: product lead time is used for replenishment, the supplier average on the supplier view, and the snapshot copy is hidden. The effective reorder point is the higher of ReorderPoint and SafetyStock, since a trigger below the buffer would under-flag low stock.

7. Data model and analytical approach

Products is the hub of the model. Order lines and the inventory snapshot connect only through ProductID, so stock totals are never multiplied by sales rows.

Stock status: Reorder Now means on hand plus incoming is at or below the effective reorder point. Low - Inbound means on hand is at or below it, but incoming stock lifts it above. Overstock means on hand is above 5x the effective reorder point. Healthy covers all others.

Supplier risk: High means reliability below 0.80 and an average lead time of 13+ days. Medium means either one. Low means neither.

8. KPIs and metrics

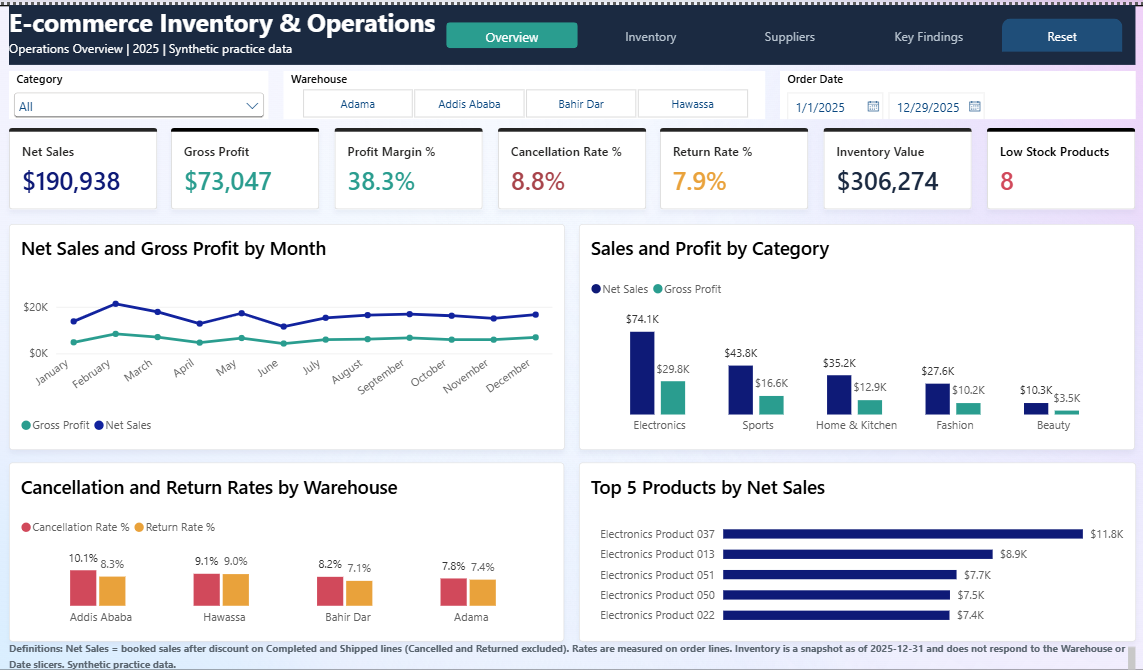
Headline numbers: Net Sales $190,938; Gross Profit $73,047 (38.3% margin); 17.9% of booked sales lost to cancellations and returns; overstock value $95,000 (12 products); inventory value $306,274 (4,348 units, 60 products); $99,603 of stock held by 3 high-risk suppliers.

Rates: cancellation rate 8.8% (79 of 898 lines) and return rate 7.9% (65 of 819 delivered lines).

Definitions: Net Sales is booked sales after discount on Completed and Shipped lines (Cancelled and Returned excluded). Gross Profit is Net Sales minus unit cost x quantity on the same lines, an estimate with no shipping or handling costs. Cancellation rate is cancelled lines divided by all order lines. Return rate is returned lines divided by non-cancelled lines.

9. Dashboard design

Executive Overview: how the business is performing, with sales, profit, and cancellation and return rates by month, category, warehouse, and product.

Inventory Analysis: what needs ordering, what is overstocked, and where cash is tied up. Status colors flag urgency.

Supplier Analysis: where revenue leaks by warehouse, and which suppliers carry risk.

Findings & Recommendations: the five insights and three recommendations next to the headline numbers.

10. Key findings

1. 17.9% of booked sales never becomes revenue. Of $232.6K booked, $23.6K was cancelled (10.2%) and $18.0K was returned (7.7%), leaving $190.9K in net sales.

2. Electronics carries the business. It earns $74.1K, about 39% of net sales, at the best margin (40.2%, against 34% to 38% elsewhere). All five top-selling products are Electronics, which is a concentration risk as well as a strength.

3. Overstock ties up 31% of stock value. Twelve products hold $95.0K of the $306.3K inventory. The five largest hold $69.8K, led by Electronics Product 051 with $30.5K and 272 weeks of cover. At the 2025 sales pace, total stock covers about 121 weeks.

4. Stock-out risk is small, but sits with a risky supplier. Only 8 of 60 products are low, and five of those have stock incoming. Three have nothing incoming: Fashion 003, Electronics 047, and Home 045. Two of the three come from Supplier 10, rated High risk (reliability 0.75, 13-day average lead time), though their cover is 12 to 28 weeks. The three High-risk suppliers hold $99.6K, or 32.5% of stock.

5. Warehouse differences are modest. Addis Ababa has the highest cancellation rate (10.1%) against 7.8% at Adama. Hawassa has the highest return rate (9.0%). Only about 6 lines separate the best and worst warehouse, so this is a signal to monitor, not proof of a problem. Products from High-risk suppliers cancel more often (9.5% of lines) than those from Low-risk suppliers (7.1%), on a modest sample.

11. Business recommendations

Priority 1, immediate (Purchasing): order the three products with nothing incoming. Start with Supplier 10's two items, ask for confirmed delivery dates, and line up a backup supplier. Track the Low Stock Products count.

Priority 2, next (Inventory planning): stop reordering overstock and run it down, starting with the five largest overstocked products ($69.8K). Set a stock ceiling (the dashboard uses 5x the reorder point) so overstock does not rebuild. Track Overstock Value.

Priority 3, ongoing (Operations): find out why orders are cancelled and returned by recording a reason for every cancellation and return. Review Addis Ababa cancellations and Hawassa returns first, and add supplier performance to the review. Track the cancellation and return rates.

12. Limitations

One inventory snapshot: there is no stock history or demand variability, so the analysis shows position, not a stockout forecast. Weeks of cover use 2025 sales and are indicative only.

OrderID is not a reliable order header: many orders span several dates, warehouses, and statuses, so all rates are measured on order lines.

No warehouse on inventory: stock cannot be analyzed by warehouse, and inventory figures ignore the Warehouse and Date slicers.

Missing detail: there are no reason codes for cancellations or returns, and profit is an estimate based on unit cost only. Supplier reliability is a given score, and the status and risk thresholds are analyst judgments that can be changed.

Small samples and synthetic data: each warehouse has about 220 lines and about 20 cancellations, so warehouse differences are fragile. The data is for practice and portfolio use, and the text on the Findings page is static and does not update on refresh.

13. Tools used

Microsoft Excel, Power BI Desktop, Power Query, and DAX, with a four-page dashboard.

14. Screenshots

See the four dashboard screenshots above.

15. Conclusion

Replenishment is a small, specific problem: 3 products need an order now, and 5 more are covered by incoming stock. Overstock is the larger problem, with 12 products holding $95,000, or 31% of all stock value. Revenue leakage is material, since cancellations and returns remove 17.9% of booked sales. Warehouse differences are modest, and supplier risk is concentrated in three suppliers that hold about a third of the stock.
Sales Analytics / Customer Analytics

E-commerce Sales & Customer Analysis

An interactive Power BI project examining sales performance, product and category trends, customer behavior, and regional sales patterns. This is a personal portfolio project.

Dashboard screenshots

Case Study

1. Project overview

A personal portfolio project on a practice dataset (2025). A simulated online retailer wants to know what drives revenue and profit, which customer groups perform best, and where to act next. I played the freelance BI analyst: I inspected and cleaned a three-table workbook, built a validated star-schema model with DAX measures, and delivered a three-page Power BI dashboard with insights and recommendations.

Because it is a practice dataset, every finding describes this data only.

2. Business problem

The retailer needs answers to three questions: how is the business performing and when does it sell, what makes money and what only looks good on sales, and who and where are its best customers.

3. Project objectives

Answer the three business questions with a three-page dashboard, check every number independently, and turn the results into insights and recommendations with clearly stated limits.

4. Dataset overview

The data covers 621 sales lines (2 January to 31 December 2025), 91 customer records, and 25 products, held in a three-table workbook (Sales_Raw, Customers, and Products). A Date table was added in DAX.

It is a practice dataset.

5. Data quality issues

Duplicates: sales row SR0028 appeared twice, and customer C0011 appeared twice.

Missing values: 12 lines had gaps (OrderDate 3, CustomerID 2, Quantity 4, UnitPrice 3).

Inconsistent text: status variants such as "COMPLETED" and padded spaces, padded payment methods, and "electronics " split from Electronics.

Unreliable OrderID: 155 of 394 OrderIDs contain lines from more than one customer.

Dates before signup: 79 lines (21 customers) are dated before the customer's SignupDate.

6. Data cleaning and transformation

In Power Query I removed exact duplicates (621 to 620 sales rows, 91 to 90 customers) and trimmed and standardized OrderStatus, PaymentMethod, and Category into 4 statuses, 4 payment methods, and 5 categories. I also added two flag columns, MissingFields and ValueCalculable.

Lines with missing values were kept, flagged, and never imputed, so no rows were deleted because of missing values. OrderID was kept as the order key per the client dictionary, with the caveat documented. Lines dated before signup were kept and documented, and no new-versus-returning analysis was attempted.

7. Data model and analytical approach

Model: a star schema with Sales_Raw as the fact table and Customers and Products as dimensions, all one-to-many with single-direction filtering. The Date table was built in DAX for 1 January to 31 December 2025, marked as the date table, with months sorted in calendar order.

Validation: I recalculated Gross Sales, Discount, Net Sales, Cost, and Profit in Excel on a de-duplicated copy of the raw file. All five matched Power BI exactly: 73,846.21, 3,713.23, 70,132.98, 43,416.97, and 26,716.01.

All 620 lines are accounted for: 507 Completed and calculable, 5 Completed with a missing quantity or price, 38 Returned, 43 Cancelled, and 27 Pending. Region, segment, category, and month views tie back to the totals, with two documented differences: the region and segment tables total 69,886.76 because one Completed line (246.22) has no customer, and the monthly trend excludes two lines (280.49) with no date.

8. KPIs and metrics

Net Sales = Quantity × UnitPrice minus the discount, on Completed lines with a quantity and price. Only Completed lines count toward Net Sales, Cost, and Profit. Returned lines feed the return rate, and Cancelled and Pending lines are excluded.

Profit = Net Sales minus Quantity × UnitCost (UnitCost is an estimate). Return Rate = Returned lines ÷ (Completed + Returned lines), line-based because the data has no refund amounts or dates. Average Order Value = Net Sales ÷ distinct OrderIDs. Shipping fees are excluded because the data does not say whether they are per line or per order.

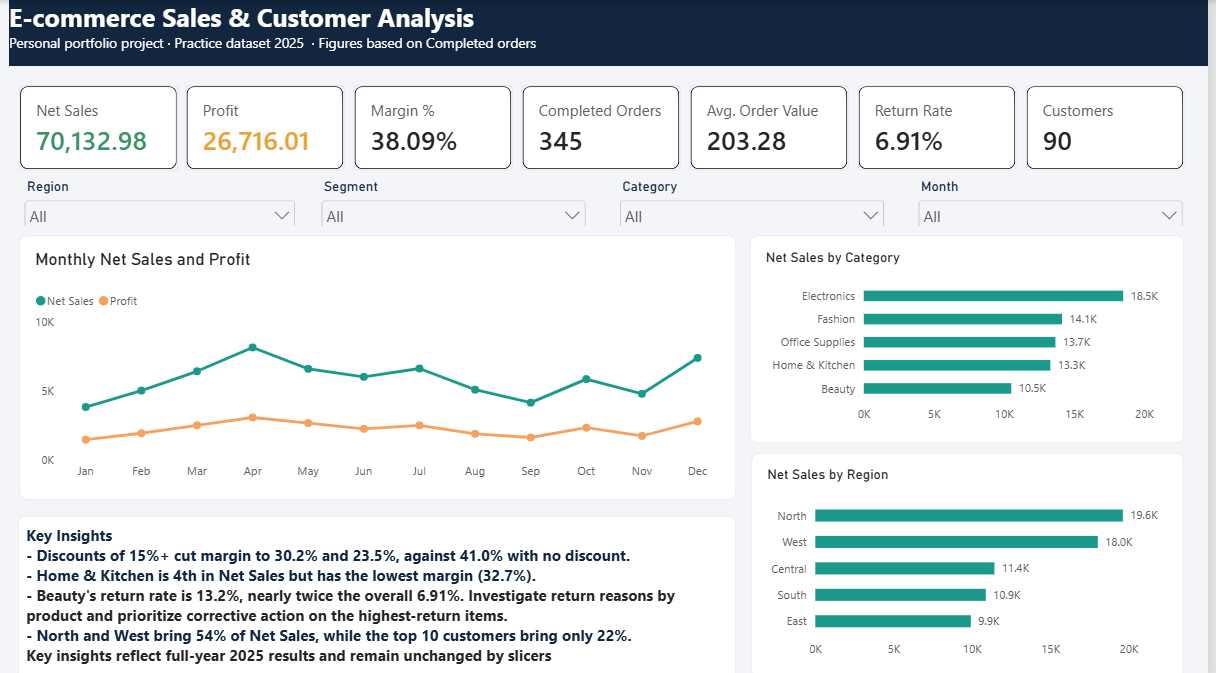
Headline values: Net Sales 70,132.98; Profit 26,716.01; Margin 38.09%; Completed Orders 345; Average Order Value 203.28; Return Rate 6.91%; Customers 90.

9. Dashboard design

Executive Overview: seven KPI cards, a monthly trend, Net Sales by category and region, and a Key Insights panel.

Product & Category Analysis: sales versus margin by category, top 10 products by profit, margin by discount level, and return rate by category.

Customer & Regional Analysis: Net Sales by region and segment, top 10 customers, and region and segment performance tables.

Region, segment, category, and month slicers are synced across all three pages.

10. Key findings

1. Discounts cut margin steeply. Margin falls from 41.03% with no discount to 23.54% at 20%. Lines discounted 15% or more are about 17% of Completed lines and 13.4% of Net Sales, but only 9.8% of Profit. The same pattern appears inside Home & Kitchen (35.1% at no discount, 21.0% at 20%), so it is not only a product-mix effect. The data cannot show whether discounts brought extra orders.

2. Home & Kitchen sells well but earns the least. It ranks fourth in Net Sales (13,306) with the lowest margin, 32.69%, against 37% to 41% for the other categories. It is also lower without discounts (35.1% versus 40.4% to 44.9%), so discounting is not the cause. The data does not say why.

3. Beauty has the highest return rate. It is 13.2% (15 of 114 lines) against 6.9% overall, while Home & Kitchen had none in 103 lines. The counts are small and no return reasons exist, so this is a place to investigate rather than a conclusion.

4. Regional gaps come mostly from customer count. North and West bring 53.9% of Net Sales with 46 of 90 customers. Sales per customer are similar across most regions (762 to 827), but South is lowest at 640.02. South has the highest margin (40.30%) and East the lowest (35.12%).

5. Sales are not concentrated. The top 10 customers account for 21.7% of Net Sales. Consumers bring 63%, while Corporate is the smallest segment (11 customers, 11.5% of sales) with the best margin, 39.64%.

The monthly trend peaks in April (8,147) and is lowest in January (3,821) and September (4,139). With one year of data this cannot be called seasonality.

11. Business recommendations

1. Set a cap or approval rule for discounts above 10% and test it for a quarter. Monitor Profit Margin % by discount level and the share of lines at 15% or more (now about 17%).

2. Review Home & Kitchen prices and costs product by product. Monitor category Profit Margin % (now 32.69%).

3. Investigate Beauty returns by collecting return reasons. Monitor Return Rate by category (now 13.2%).

4. Test growing the customer base in South and East before raising spend per customer. Monitor Unique Customers and Net Sales per Customer by region.

12. Limitations

One year of data, with no targets, benchmarks, or prior-year comparison. UnitCost is an estimate, so profit is only as accurate as that estimate.

OrderID is unreliable, so Average Order Value is valid only at the total level, and per-region order counts add up to 458, not 345. 79 lines are dated before the customer's signup date, so new-versus-returning analysis was not attempted.

There are no refund amounts, return dates, or return reasons, and the outcome of the 27 Pending lines is unknown. No currency is stated, and the findings show association, not cause.

13. Tools used

Excel, Power Query, DAX, and Power BI Desktop. Excel was also used for independent validation.

14. Screenshots

See the three dashboard screenshots above.

15. Conclusion

In this dataset, discounting and product mix explain much of the margin gap, Beauty returns and Home & Kitchen profitability are worth investigating, and regional differences come mostly from customer count. Sales are not concentrated in a few customers.

Skills demonstrated: data profiling and quality assessment, Power Query cleaning, star-schema modeling, DAX measures with explicit business rules, independent validation in Excel, dashboard design, and evidence-based insights with clearly stated limits.

Retail Analytics / Profitability Analysis

GreenMart Sales & Profitability Analysis

A Power BI dashboard project focused on presenting sales and profitability information for business performance monitoring. This is a personal portfolio project.

Dashboard screenshot

Case Study

1. Project overview and business problem

GreenMart is an online store that wanted a single-page view of its sales and profit performance. This is a practice project built on a practice dataset with a simulated client brief (not paid client work), covering 1 January to 31 December 2025.

The brief, "GreenMart Online Store - Sales and Profit Performance Dashboard", asked four questions: how much does the store sell and earn, which products and categories drive it, which regions perform best, and how does performance change through the year?

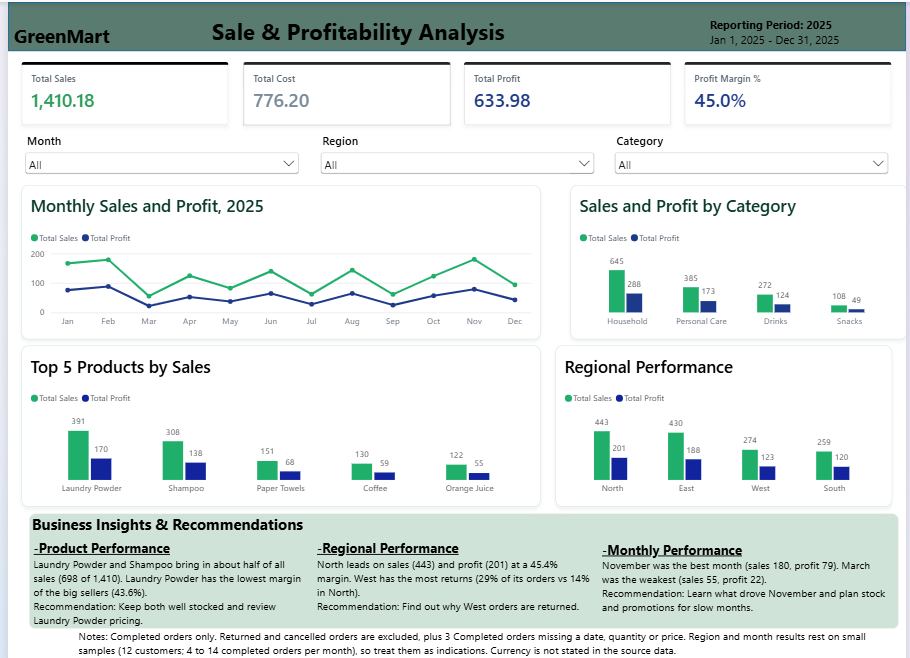
Headline numbers: Total Sales 1,410.18; Total Cost 776.20; Total Profit 633.98; Profit Margin 45.0%.

Deliverables: a cleaned data model in Power BI (Power Query and DAX), a one-page dashboard with KPI cards, three slicers (Month, Region, Category), and four charts, plus data-backed insights with recommendations.

2. Data and approach

The source is an Excel workbook with three sheets: Sales_Raw (the order lines), Customers, and Products. The data was cleaned in Power Query and linked in the Power BI model. The analysis covers Completed orders only.

Measures: Total Sales is the sales value of Completed orders. Total Cost is the cost of the same orders, as recorded in the source. Total Profit is Total Sales minus Total Cost. Profit Margin % is Total Profit divided by Total Sales.

Data handling: returned and cancelled orders are excluded, so the figures describe completed business only. Three Completed orders were excluded because they were missing a date, a quantity, or a price. The source does not state a currency, so values are shown as plain numbers instead of assuming a currency symbol.

3. Dashboard design

The page reads top to bottom: headline numbers, then filters, then the monthly trend, the category, product, and regional breakdowns, and finally the insights panel.

No scrollbars or hidden items: every category, region, and month is visible, and the product chart shows the Top 5 products by sales.

One color per measure: green is always Total Sales and navy is always Total Profit, across every chart and card.

Consistent number formats on all cards and chart labels, with no abbreviations that blur small values.

A straight-line monthly trend, so the chart does not imply values between months that are not in the data.

Simple filters: the Month, Region, and Category slicers show their items without a Select all option.

4. Insights and recommendations

1. Two products carry about half of sales. Laundry Powder (390.55) and Shampoo (307.81) bring in 698 of the 1,410 total, about 49.5%. Laundry Powder has the lowest margin of the big sellers (43.6%, against 44.7% for Shampoo and 45.0% overall). Recommendation: keep both well stocked and review Laundry Powder pricing.

2. North leads, and West has the most returns. North has the highest sales (443) and profit (201), at a 45.4% margin. North and East together make about 62% of sales. West has the most returns: 29% of its orders, against 14% in North. Recommendation: find out why West orders are returned.

3. November was the best month, March the weakest. November reached sales of 180 and profit of 79. March was the weakest month, with sales of 55 and profit of 22. Recommendation: learn what drove November, and plan stock and promotions for the slow months.

Also worth noting: Household is the largest category (645 of 1,410, about 46% of sales), followed by Personal Care (385), Drinks (272), and Snacks (108). Margins sit in a narrow band (about 44% to 46%) across the products, categories, and regions shown, so differences in profit mostly follow differences in sales.

5. Limitations

Small samples: the data covers 12 customers, with 4 to 14 completed orders per month, so region and month results are indications, not firm conclusions.

Completed orders only: returned and cancelled orders are excluded, and three Completed orders with missing fields were left out.

One year of data (2025): there is no earlier period to compare with, and no seasonality can be confirmed.

No currency is stated in the source data.

Practice dataset: the brief and data are simulated for portfolio use.